
There are several heuristics that can give me an indication of max heart rate. These give me a good starting point, but heuristics are imprecise. Additionally, I have about 800+ historical data points from my Garmin that report max heart rate on my runs. This is highly specific to me which is great, but IOT devices are prone to error. Can I combine both to get a more accurate estimate of my max heart rate? Maybe.
Before going into numbers, I think it’s helpful to know that your max heart rate doesn’t increase or decrease with fitness. As you get fitter, you increase your ability to run (or exercise) for longer periods of time closer to your max heart rate. Although it doesn’t change with fitness level, max heart rate does decrease with age. That’s where we start.
A Good Prior Estimate
Prior to looking at any data, there are a few heuristics you can find online to estimate a range of your max heart rate. From this site, here are two that potentially apply for me as a long distance runner:
- [ 220 – Age ]. This is the most common and widely used calculation. I’m 38, so this would indicate that my max heart rate is 182.
- [ 211 – 0.64 x Age ]. This calculation is adjusted for generally active people. Again, I’m 38 so this would indicate that my max heart rate is 187.
I could say my starting range is 182-187. But, this research on elite distance runners from back in the day says that “the average maximal heart rate achieved during the treadmill test was 198 BPM. The average maximal heart rate for men in this age group [late 20’s] is approximately 190 BPM.” That’s ~4% higher for elites than non-elites. I’m not an elite distance runner, but I’ve been close. So, I’ll take the max heart rate for generally active people at my age and add 4% to use a top of the range starting estimate of 194. That means the starting range is 182-194 with a midpoint of 188.
The Data
Now that I have a good prior, I can bring in data. First, outliers. I take out the 2 observations where Max.HR is over 200. At this point, what if I just said the highest Max.HR is my max heart rate in the dataset? Then I would believe my max HR is 199 – considering my age and the info about the elite distance runners, this seems unlikely. What if I just said the 98th percentile of all the Max.HR’s in the dataset is my max heart rate? Then, 192. Maybe. With that “benchmark”, let’s execute the process of mathematically combining my domain knowledge based priors with the data.
On most days of running, I’m not pushing the envelope to the max. This means that on most days I won’t get close to my max heart rate (even though there is a data point called Max.HR on every run). I’m going to filter my Garmin running data to get a large enough, but hopefully representative, sample. I bailed on 2 different methods before landing on a third.
Method 1: Filter to Known Hardest Efforts.
I’ll filter my Garmin running data to only activities where either the average mile pace was below 5:30 minutes or the distance was over 20 miles. If my Garmin data also included temperature, I would include runs where it was 70+ degrees Fahrenheit (a project for another day!).
Well, that leaves me with very few data points (only 3). It’s reasonable though. The days where I pushed myself hardest were race days – 2 marathons – and a Turkey Trot.
Method 2: Filter to Max HR Above Lower Limit of 182
There are certainly days when the sun is beating down and the temperature and humidity are just pounding… as is my heart. I find it possible and reasonable that I get close to my max heart rate on these days even though I’m not running particularly long or fast.
This gives me 111 data points to fit my model. More observations, great! Something still feels wrong, though. If I have a lot of workouts where I am targeting a hard, comfortable pace that I think push me right over a heart rate of 180. This method, I believe, will result in me underestimating my max heart rate.
Let’s see if the third time’s a charm…
Method 3: Sort Data by Descending Max HR Value and Filter to Top 5%
This third method focuses on my hardest efforts, but prevents me from focusing too narrowly on potentially erroneous data created by faulty IOT measurements. This means I am using 42 observations. I’m going to run with it for now. However, if you have suggestions on a better approach I am all ears!
The Prior Distribution
To craft the starting range as a quantitative distribution, I assume the mean is 188 with a standard deviation of 1. However, the standard deviation could be anywhere between 1 and 6 (inclusive). Using those inputs to create a prior predictive simulation gives me a starting distribution of possibilities that looks like this:
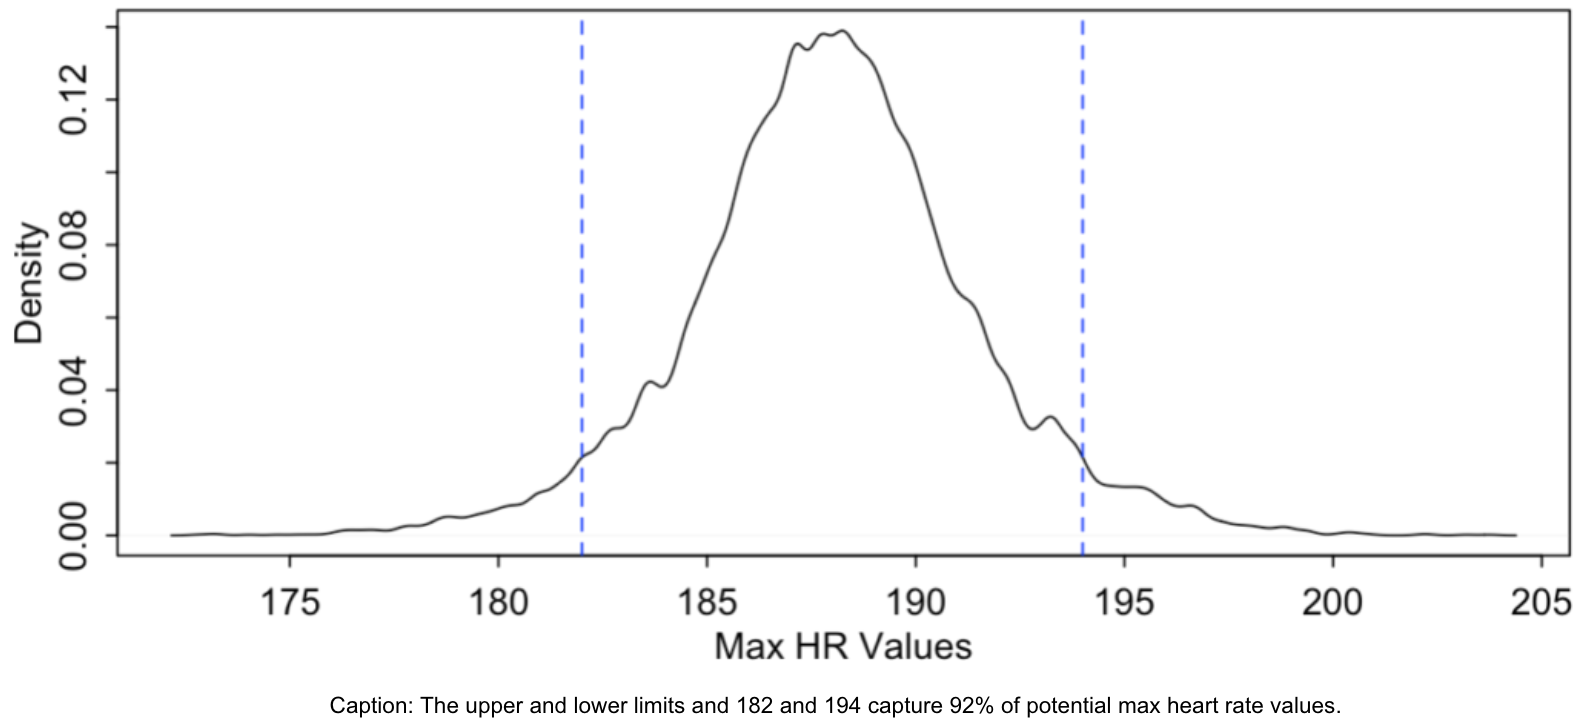
This prior distribution means that I believe that there’s a 92% chance my max heart rate falls in between the values of 182 and 194 (inclusive) with the most likely value around 188. That’s aligned with the starting range defined above.
This is the model. Now, let’s adjust it with the data.
The Posterior Distribution
There are a few steps to quantitatively update our initial estimate above (the prior) with the data. You can see those steps in this R script. Here, I’ll focus on the outputs.
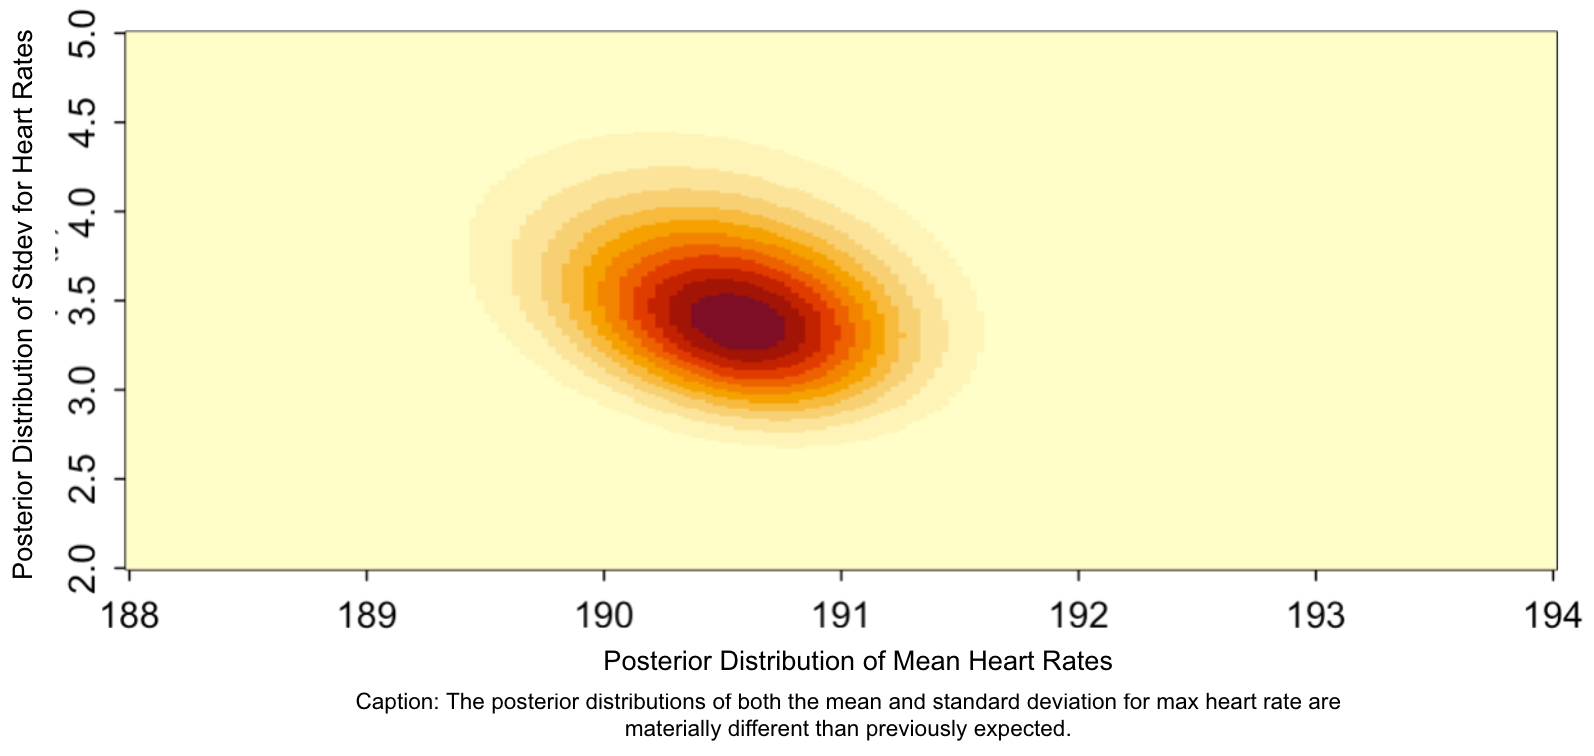
First, a heatmap of the output simulation values shows me that the average (aka the midpoint) lies somewhere between 190-191 and the standard deviation between 3 and 4. This is immediately interesting for two reasons. First, the average is strictly different from the crude “benchmark” above of 192 or the prior midpoint of 188. Second, the standard deviation is considerably higher – between 3.5 and 4.0 – than in my priors (which I guessed was 1). To put it another way, the data has actually made me less certain of the spread of values than I was before.
Second, a density chart of the posterior distribution.

It’s similar to the prior distribution, isn’t it? Yes, but it has shifted. The 89% confidence interval is 185 to 196 (note that I’m rounding here). To make it an apples to apples comparison with the 92% metric stated earlier when describing the prior distribution… we also plot the vertical blue dashed lines representing the 182 and 194 upper and lower bounds. I now believe that there’s a 84% chance that my max heart rate falls between the values of 182 and 194 (inclusive) with the most likely value around 190. The data is telling me that my prior is too conservative and that there is a higher probability than I thought that my max heart rate is higher than 194. Maybe this is true, maybe it’s simply an erroneous result of how I filtered the data.
Closing
Even with all this data, I still don’t have a precise answer to what my max heart rate is. Based on both my domain knowledge and personal data, it’s possible that my max heart rate is 186, but also possible that it’s 195. So what?
The implication comes when determining a good HR threshold for pace runs. Should I target 170? How about 175? Maybe 180?
“Threshold, also known as lactate threshold or anaerobic threshold, is a pace carried out at an intensity level that your body can no longer keep up with the amount of lactic acids being produced. This anaerobic threshold sits somewhere between your 10k race and half marathon race effort. For most runners, this pace will be 80 to 90 percent of their maximal heart rate.”
If my best guess is that my max heart rate is 186, my threshold run heart rate is 167bpm (at 90%). Hmm. What if my best guess is that my max heart rate is 195? That means I think my threshold run heart rate is 176. Since I don’t have a strong opinion either way, it seems like the best approach is to start with the midpoint of the posterior distribution – 190 which equates to a threshold run heart rate of 171 – and experiment from there logging the target HR value and going a little higher each time.
At this point, I have a great idea of the potential values of my max heart rate. It’s detailed enough that I can make good decisions about training with my coach. I am comfortable enough with uncertainty that I can live with a distribution for the answer to “what is my max heart rate?” and experiment over the next few weeks to find that sweet spot for pace runs.
——-
I would love to do a code review on this if anyone can spare 30 minutes – ping me!